
Background
Recent years in Canada have seen an uptake of interest in equity initiatives, even as many non-profit organizations report struggling to secure funds, skills and capacity to prioritise addressing the lack of equity, diversity and inclusion in workplaces(1). Organisations in Canada continue to pursue this important work, despite alarming backlash in the neighbouring United States, resulting in setbacks on decades of US progress. This regression underscores how critical it is to re-assert the importance of this work and recommit to the values of justice, diversity and inclusion.
Our survey emerged out of the need for more data on equity, diversity, and inclusion in the Environmental Non-Governmental Organization (“ENGO) sector. Anecdotally, colleagues in the nature, environment and climate sector have experienced and shared observations that the sector is still largely dominated by white settlers of European ancestry, particularly in leadership roles. We found that data clearly illustrating the state of racial representation among staff in the ENGO sector was lacking.
Thus, this report, and the survey that informed it, seek fill this gap in information and capture a point-in-time-picture of Indigenous and racialized representation among Canada’s ENGOs. This allows us to both better understand the problem and thus how to solve it, as well as track changes in demographic representation over time. Further, it aims to support ENGOs that would like to explore the use of affirmative action practices in their staff recruitment efforts. All legal jurisdictions in Canada allow for such initiatives—often called “special programs”—and indeed, some encourage or even require it in certain circumstances. Data to illustrate the need for affirmative action is helpful, even as criteria for what specific data is needed to support or defend such programs varies by province.
This work has been gratefully led by Nature Canada, aided by funding and distribution support from The Sustainability Network.
Summary Conclusions
- Survey results point to progress being achieved in closing the gap in representation in some instances. For example, survey responses showed representation on par with the population on a national level, with respect to Indigenous peoples working in the sector.
- There are still significant gaps to address. For example, in the couple instances where survey responses showed representation on par with population for employees, they still fell significantly short on representation in leadership positions.
- There was a correlation between organizations that responded positively to questions about prioritising equity policies/practices and their rates of representation. Organizations that invested in creating equitable workplaces showed better representation figures.
- There is still work to do to counter generations of inequity. Organizations can continue to see progress on closing these gaps if they commit to learning and applying the skills and strategies that are proven to improve inclusivity and equity in the workplace.
Methodology
This report draws on a voluntary, anonymous survey sent to nature and climate organizations across Canada from August 1 through September 6, 2024. The survey was re-opened to allow for additional responses for an additional two weeks thereafter. Responding organizations were not randomly selected, nor is there reliable data for the total number of organizations in the sector with staff. It is unclear how many organizations the survey reached in total, as it was generously distributed by several networks. As such, results should not be taken as statistically sound, but rather a snapshot that provides a sense of the current reality.
Responses were likely limited by knowledge of internal identities by organizational leaders and therefore in some instances, subject to perception. Similarly, the data possibly reflects “responder bias” such that organizations that perceive their representation of diverse peoples to be poor may opt to not participate. It is also likely that questions, such as the level of priority given to equity initiatives, were subject to perception and bias of the individual that responded.
Core questions were designed to surface the approximate percentage of staff, and of paid senior leadership roles (not including volunteer Boards), that identified as being from Indigenous or racialized communities. To align with 2021 national census data and definitions for comparison, “Indigenous” included First Nations, Métis, and/or Inuit people.
Similarly, census data uses “Indigenous” and “Visible Minority” as demographic categories (though the latter term is being phased out), whereas the survey asked about Indigenous representation and about “Indigenous, Black or as members of racialized communities,” often referred to as “BIPOC.” To compare BIPOC data from the survey with census data, census population figures for “Indigenous” and “Visible Minority” were combined as the comparator for “BIPOC.”
The rationale for surveying along these particular demographic lines was to test the theory that the ENGO sector is “White dominant and White-led,” and ultimately, to support affirmative actions to address this specific problem in under-representation.
Additional questions were added to facilitate analysis by province and territory (where organizations are headquartered), by organization size (per staffing level), and by self-reported level of priority or effort put toward equity, diversity and inclusion.
Analysing by some categories was limited by small sample sizes per category, so the body of this report focuses on where data samples were sizable enough to draw conclusions. For example, most provinces had less than 10 responses, so only Ontario, BC and Alberta appear in the findings, as well as an aggregate look at the Atlantic Provinces. All provincial data, including sample size, can be found in the appendix, as well as all survey questions.
In total, 198 organizations participated in the survey. Organizations reporting zero staff were not posed these questions. As a result, only 147 of the 198 provided responses to the questions related to racial representation in staff and paid leadership roles. Representation figures, as presented in this report, reflect an average among all responses for the respective categories.
Key Findings
Canada
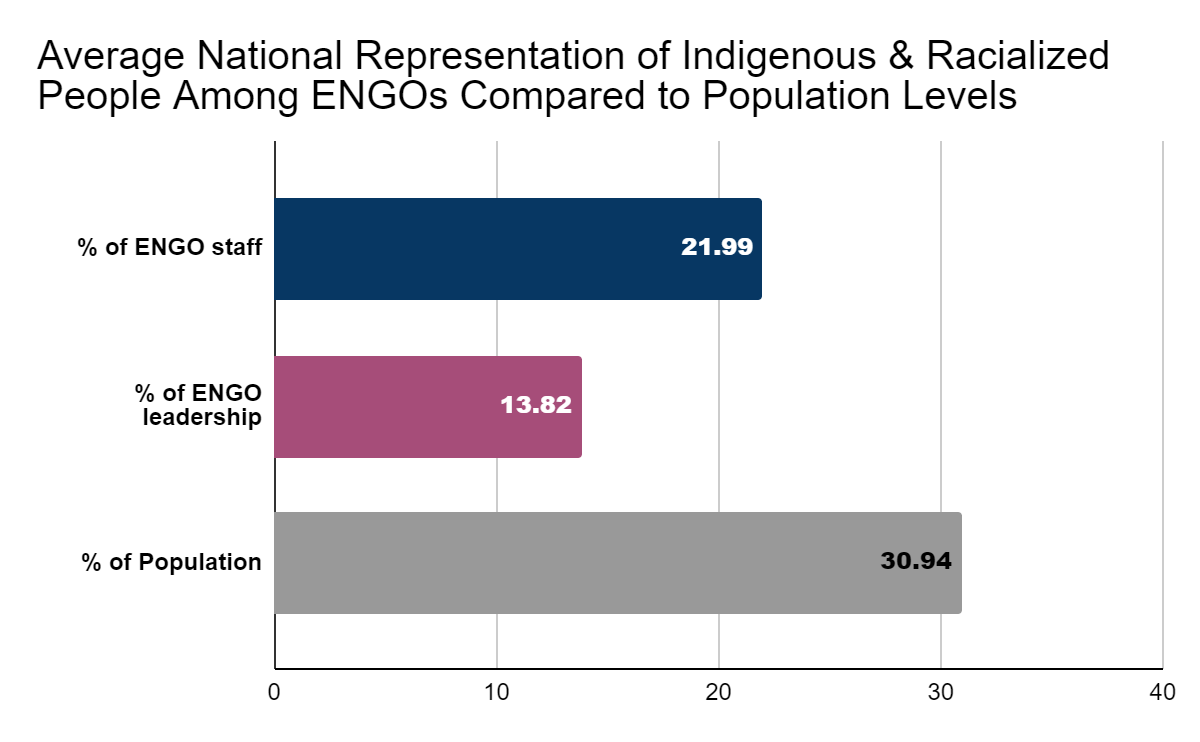
The 2021 census shows 30.94% of the population identifies as Indigenous or as being from a racialized community (“visible minority” in census terms).
Nationally, average representation among ENGO staff and leadership of people from Indigenous and racialized communities, taken together, was well below population levels.
The average representation of racialized and Indigenous folk among ENGO staff that responded to the survey was just under 22%—falling short of 30.94% of the population.
The gap in representation increases for paid leadership roles: 13.82% representation among leadership roles compared to 30.94% of the population.
Figure 1:
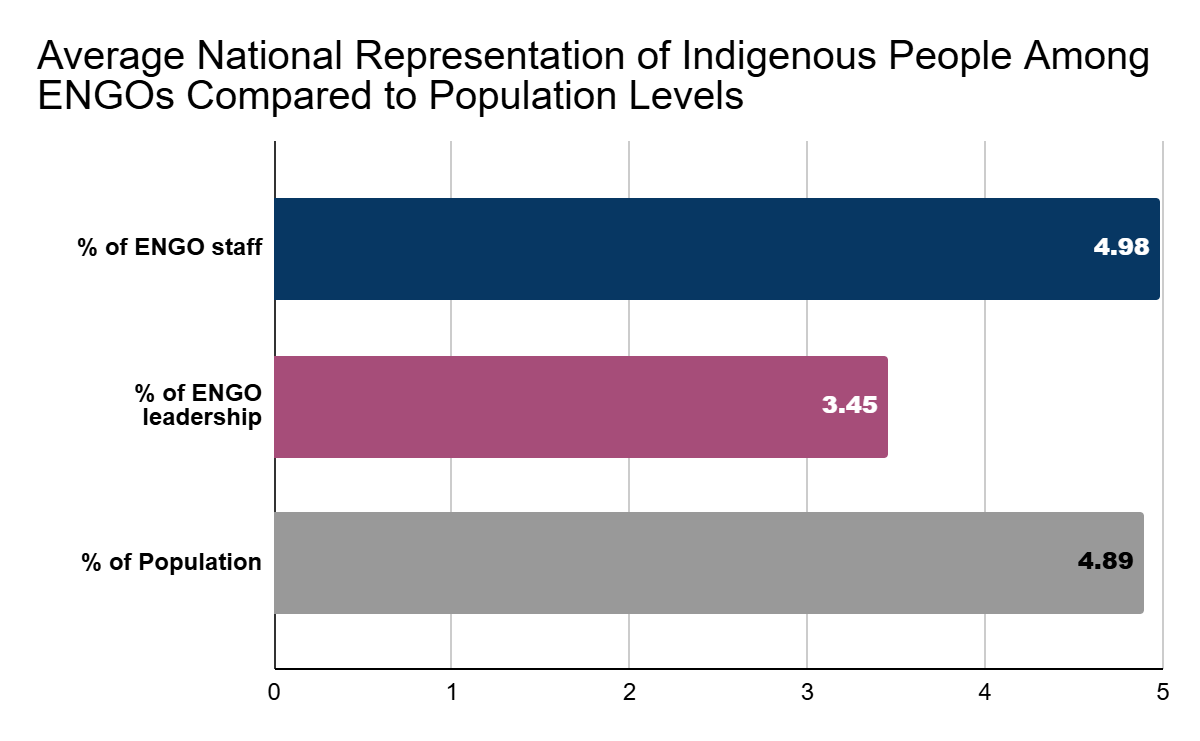
However, looking at Indigenous people only, survey responses showed representation among staff at 4.98%, approximately on par with 4.89% of the population.
A gap in representation emerges for paid leadership roles, with 3.45% of these roles reportedly held by Indigenous people, compared to 4.89% of the population.
Figure 2:
Regional
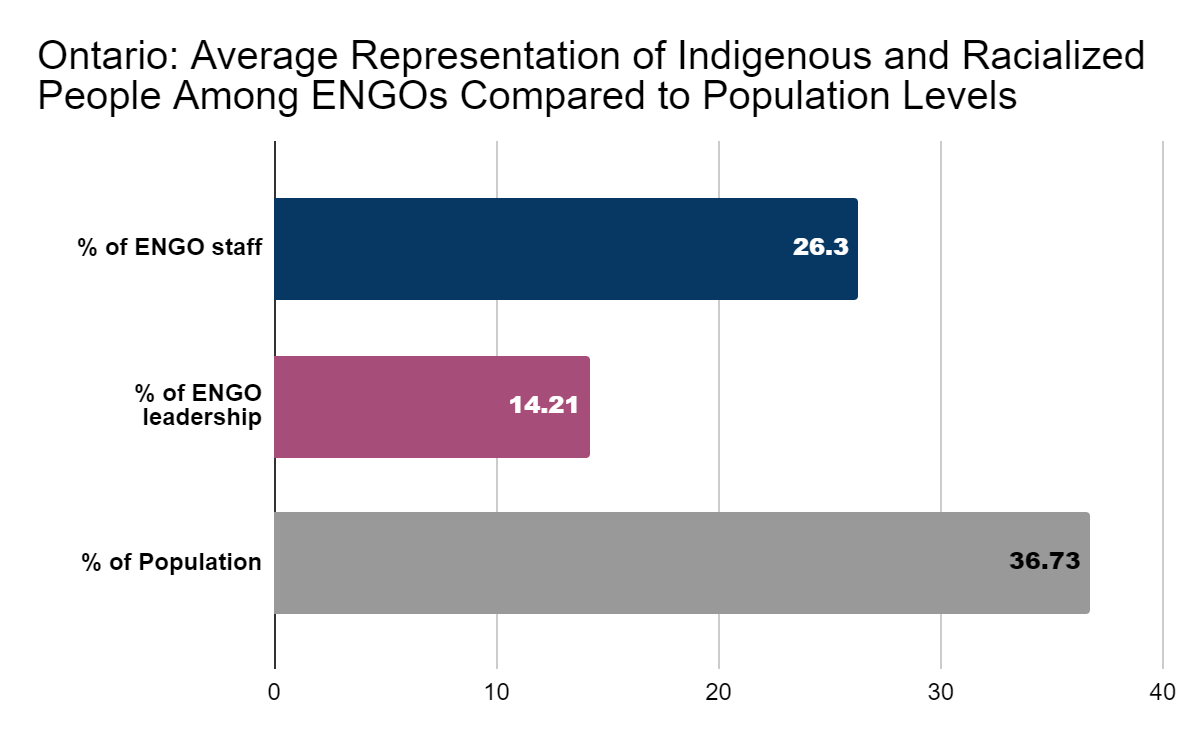
In Ontario, average representation of Indigenous or racialized people among ENGO staff was 26.3%, compared to 36.73% of the population—a similar gap to the national level. However, for leadership roles, representation drops to 14.21%, a greater gap than the national average.
Figure 3 (based on 66 responses):
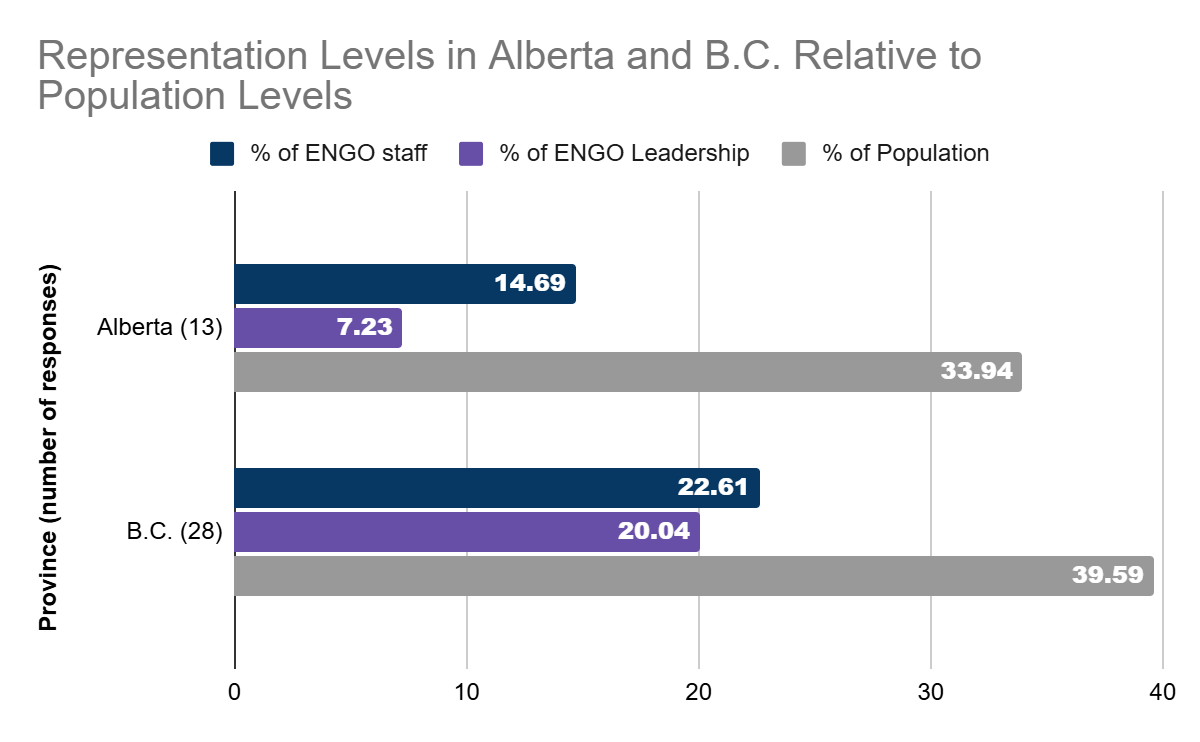
Both Alberta and British Columbia (B.C.) reported greater gaps in overall staff representation levels than the national average, with Alberta showing nearly double the national gap.
In Alberta, 33.94% of the population identified as Indigenous or racialized in the 2021 census. Alberta’s reported average of 14.69% representation among ENGO staff represents a gap nearly double the national gap.
In B.C., 39.59% of the population identified as Indigenous or racialized in the 2021 census. B.C.’s reported average of 22.61% representation among ENGO staff represents a greater gap than the national gap.
Gaps in leadership roles were greater. Alberta reported an average of 7.23% representation among paid leadership roles, far below the 33.94% population level. In B.C., Indigenous or racialized people represented 20.04% of paid leadership roles, approximately half the 39.59% population level.
Figure 4:
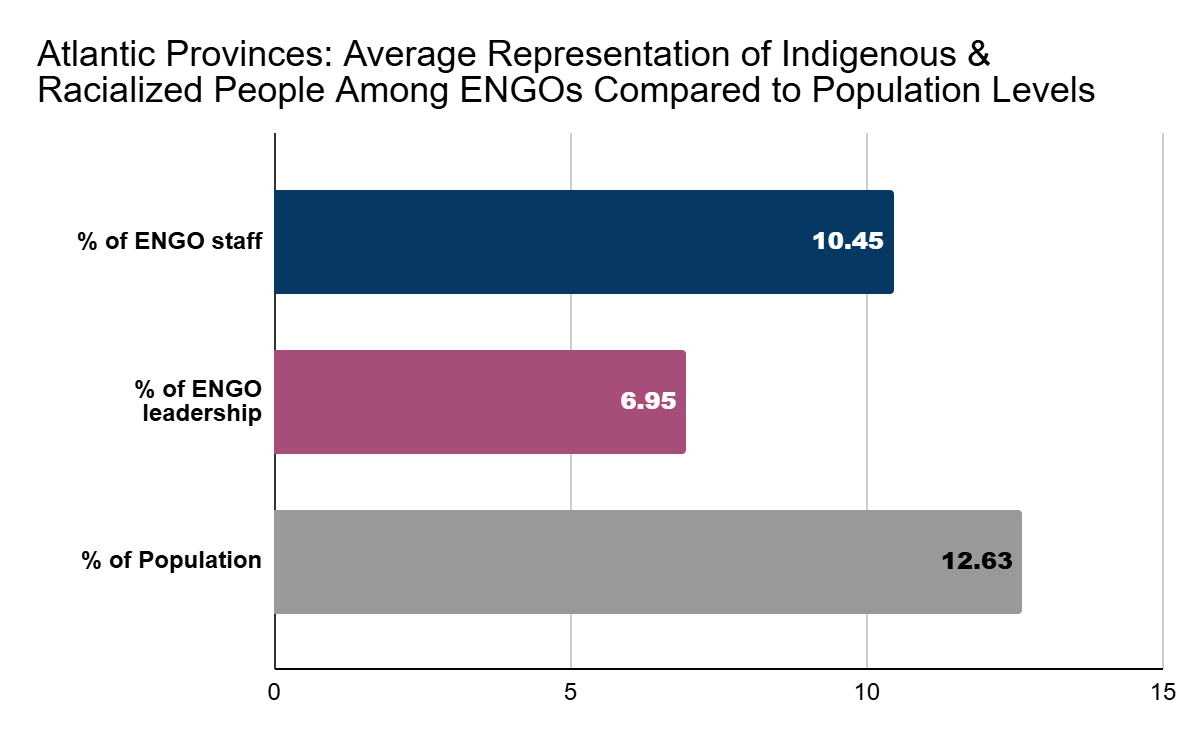
In Atlantic Canada*, average representation of Indigenous and racialized people among ENGO staff was 10.45%, compared to 12.63% of the population—a lesser gap than the national average. For leadership roles, representation drops to 6.95%, a more significant gap.
Figure 5:
Organisational Size
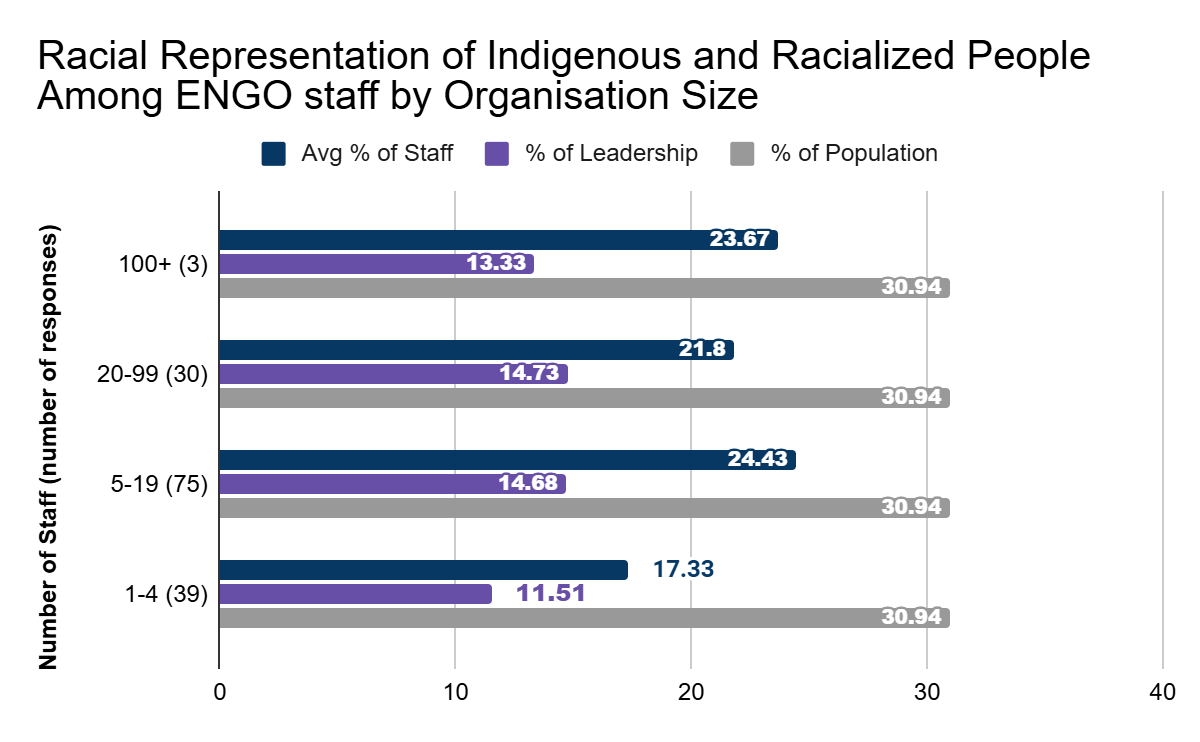
Trends for representation along the lines of organization size are non-linear, with smallest organizations reporting the greatest gaps, and mid-sized organizations reporting the least.
The smallest organizations (1-4 paid staff) showed the greatest gap in representation relative to national population levels (30.94%). Survey participants reported an average of 17.33% of staff as being from Indigenous or racialized communities, and only 11.51% of staff in paid leadership roles—both greater gaps than the national average.
Organizations with 5-19 paid staff reported the highest levels of representation on average, with Indigenous and racialized people representing 24.43% of staff, and 14.68% of paid leadership roles both lesser gaps than the national average.
Larger organizations, with 20-99 paid staff, showed average representation gaps comparable to national gaps for both staff and leadership: 21.8% of staff and 14.73% of leadership roles.
Figure 6:
Representation Relative to EDI Efforts & Priority
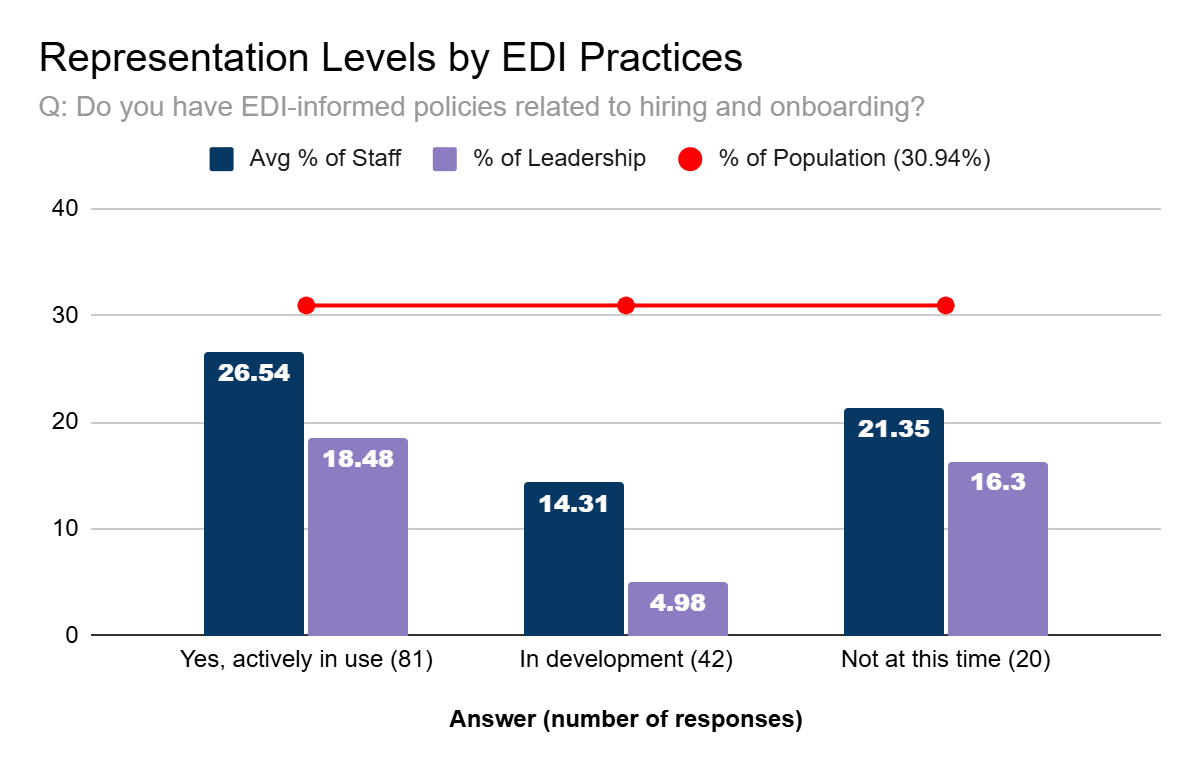
Organizations actively using policies related to improving equity, diversity and inclusion reported the highest representation levels. However, the trend was non-linear.
Figure 7:
Similarly, organizations that rated these types of efforts as the highest priority reported the greatest representation levels. They were asked: “If capacity were not a factor, on a scale of 1 5 (1 = low; 5 = highest), how much of a priority would you place on implementing EDI policies and training in your organization?” Again, trends were non-linear, but clearly showed that those leaders placing the highest priority (answering “5”) reported the highest levels of representation.
Notably, organizations that reported being Indigenous-led (80-100% representation in leadership roles) showed the best representation levels, underscoring the importance of representation in leadership to effect positive outcomes.
Conclusion
This survey reached nearly 200 nature and climate organizations across the country to ask about racial representation of staff and of paid leadership roles. Despite responder bias that might influence responses, the survey has been effective in illustrating that gaps do exist.
Results illustrated that the ENGO sector has more work to do to continue to close the gap in racial diversity. It also provided some encouraging outcomes, with some representation levels reaching or exceeding parity. This, and the positive outcomes of prioritising efforts to achieve equity, diversity and inclusion show us the way forward to continually improve on progress so far.
Nationally, respondents reported that racialized people made up only 22% of staff on average, compared to being approximately 31% of the population.
When asked specifically about staff in leadership roles, representation fell to approximately 14% less than half of what would be representative of Canada as a whole. In line with other studies (5) , representation levels drop when looking at leadership roles reflecting a need to pursue equity and inclusion within internal cultures, alongside recruiting diverse talent.
Gaps in representation, between the average percentage of racialized people among ENGO staff and any given province’s racialized population were greatest in Alberta, and lesser in Ontario and Atlantic Canada.
Mid-sized organizations, with staff of 5-19 showed the least gaps in representation, as did organizations that reported actively using EDI-informed policies or placed the highest priority on such efforts.
It’s worth emphasising that organizations that held strong commitments to establishing and practicing EDI policies and principles showed better representation (lesser gaps) of racialized and Indigenous people. Adopting EDI policies and principles is an effective approach to closing gaps in representation.
Every corner of Canada’s ENGO sector (with the possible exception of Nunavut) has work to do to actively create organizational cultures and practices that recruit and safely support staff and leadership to be reflective of our populations. And, we know that placing a high priority on developing and implementing EDI-informed policies is the way to “mind the gap” in racial representation in Canada’s ENGO sector.
Seeking additional, specific data for your region or organization may be advisable for organizations looking to explore and support affirmative action as part of their toolkits.
SURVEY
Provincial Data
To review data by all provinces, see here.
Survey Questions
PART 1: About Your Organization
- Which legal jurisdictions guide your labour practices? Select all that apply.
- Alberta
- British Columbia
- Manitoba
- New Brunswick
- Newfoundland & Labrador
- Northwest Territories
- Nova Scotia
- Nunavut Territory
- Ontario
- Prince Edward Island
- Québec
- Saskatchewan
- Yukon Territory
- We are federally registered
- Which province or territory are you headquartered in? Select one.
- Alberta
- British Columbia
- Manitoba
- New Brunswick
- Newfoundland & Labrador
- Northwest Territories
- Nova Scotia
- Nunavut Territory
- Ontario
- Prince Edward Island
- Québec
- Saskatchewan
- Yukon Territory
- Which of the following best summarises the mission of your organization? Select all that apply.**
- Conservation, restoration (habitat or species)
- Climate change policy, solutions
- Outdoor recreation, access to nature
- Education, cultural
- Indigenous-led conservation
- Primarily research, policy focused
- Primarily advocacy, campaigns focused
- Primarily advocacy, campaigns focused
- Other (write-in) **There had been an intention to analyse by type of mission, but it was determined that the question related to this would be misleading as a “choose one” question type, and was opened up to allow for “select all that apply.” One consequence of this is that data cannot be analysed along “type of mission” lines.
- How many regular (not temporary) paid staff positions do you have, including leadership and part-time, if they are regular?
- 0
- 1-4
- 5-19
- 20-99
- 100+Add skip logic to this question: If they answer “0”, SKIP to PART 3
PART 2: Racial diversity in your organization
- To the best of your knowledge, what % (approximately) of these regular paid employees identify as Indigenous, Black or as members of racialized communities (often referred to as “BIPOC”)?
- Write in: a number from 0-100
- To the best of your knowledge, what % (approximately) of these regular paid employees identify as Indigenous (First Nations, Métis or Inuit People)?
- Write in: a number from 0-100
- To the best of your knowledge, what % (approximately) of your leadership team (managers, directors etc) identify as Indigenous, Black or as members of racialized communities?
- Write in: a number from 0-100
- To the best of your knowledge, what % (approximately) of your leadership team (managers, directors etc) identify as Indigenous (First Nations, Métis or Inuit People)?
- Write in: a number from 0-100
PART 3: Capacity in your organization for equity, diversity & inclusion
- Do you have EDI-informed policies related to hiring and onboarding in your organization?
- Yes, we actively use such policies
- No, but we are in the process of developing them
- Not at this time
- If capacity were not a factor, on a scale of 1-5, where 1 = low priority and 5 = highest priority, how much of a priority would you place on implementing EDI policies and training in your organization?
- 1-5 likert scale
- Would you like to receive this toolkit once it is ready? Note: We will also provide opportunities for people to come together to learn about it and ask questions and connect with other leaders.
- Yes
- No
- Unsure / maybe
- If yes, please add your contact info, or email us at worktogrow@naturecanada.ca to get on the list.
- Anything you’d like to add about your answers above, or about barriers you face in implementing EDI or recruiting diversity?
Nature Canada is undertaking legal research and developing a toolkit to help non-profit employers understand and use affirmative action hiring as part of their EDI efforts. It aims to remove knowledge barriers related to compliance, risk, and implementation of such programs, drawing on the experience of Nature Canada’s Work to Grow program. Our hope is this will encourage other organizations to proactively diversify their workplaces so that there are abundant, inclusive career pathways for racialized folks in our sector.
Sources
- Charity Insights Canada Project, #2.37: EDI Actions & Initiatives, 2023
- Annual Non-Profit Institutions Human Resource Module, Statistics Canada, 2021
- Shifting Power Dynamics, report by Equitable Recovery Collective for Imagine Canada, 2023
- Charity Insights Canada Project, #5: Equity, Diversity & Inclusion, January 2023
- Diversity and Inclusion in Non-profit Leadership in Ontario: Are We There Yet?, CivicAction, November 2023